
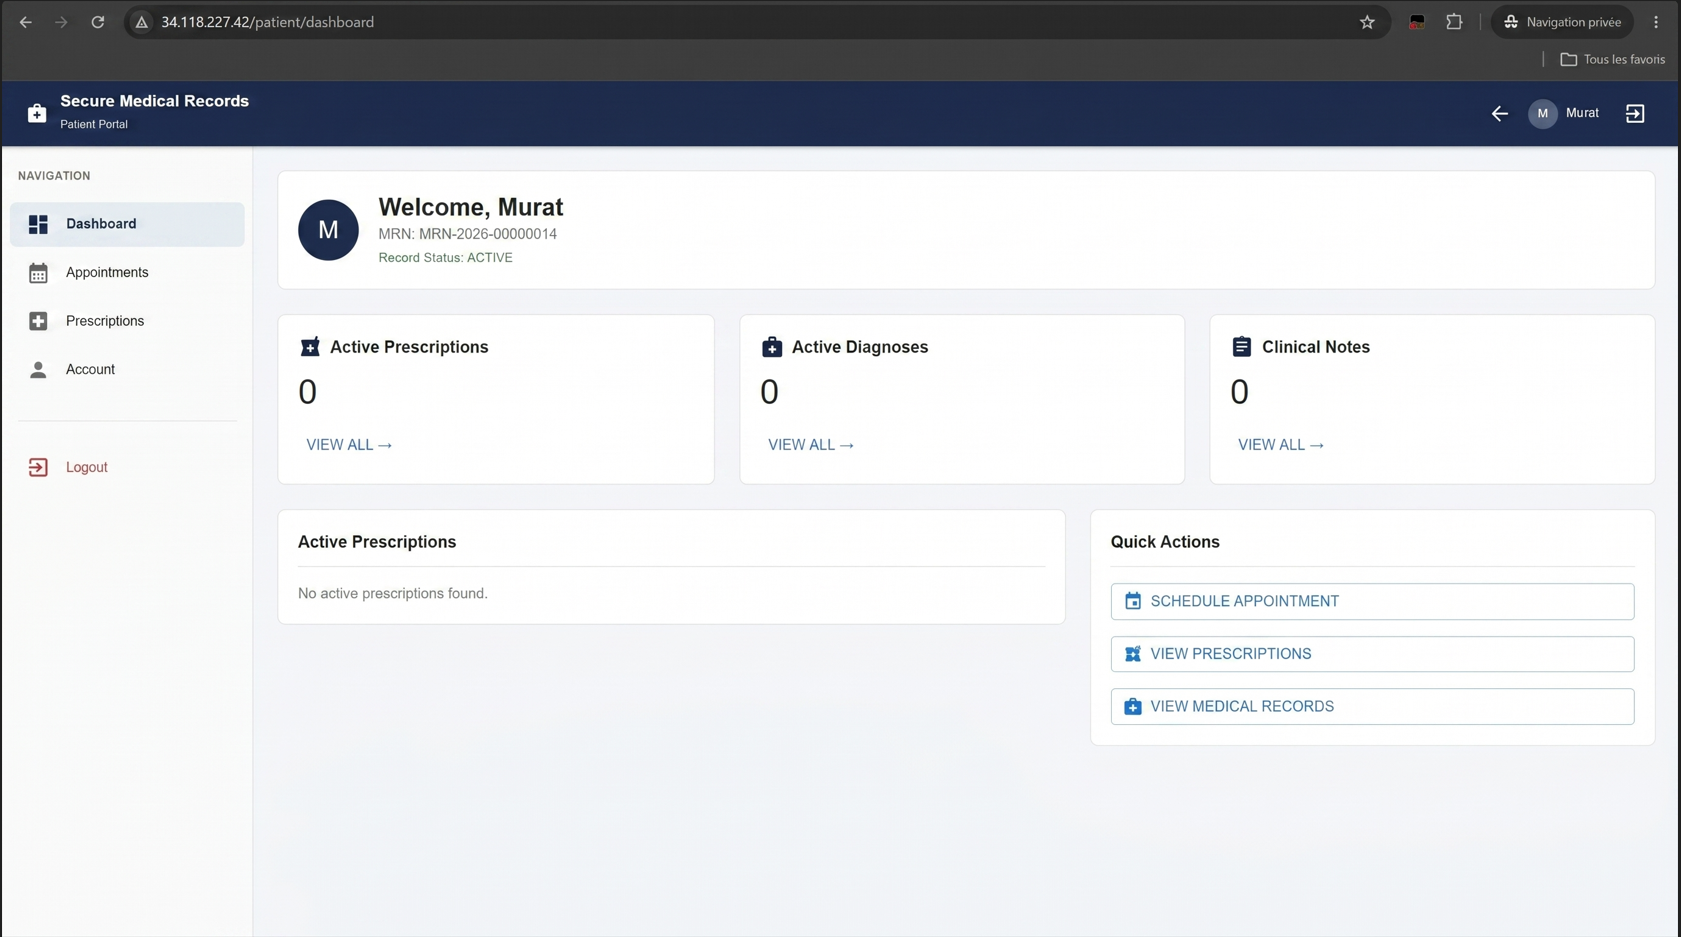
A highly secure, robust, and observable medical records portal deployed on Google Kubernetes Engine (GKE) Autopilot. This project demonstrates end-to-end DevSecOps practices, from code commit to production deployment.
🌟 Key Features
- Frontend: React Single Page Application (SPA) served via Nginx.
- Backend: Spring Boot (Java 21) REST API.
- Data Tier: MySQL (Persistent StatefulSet) and Redis (Caching & Sessions).
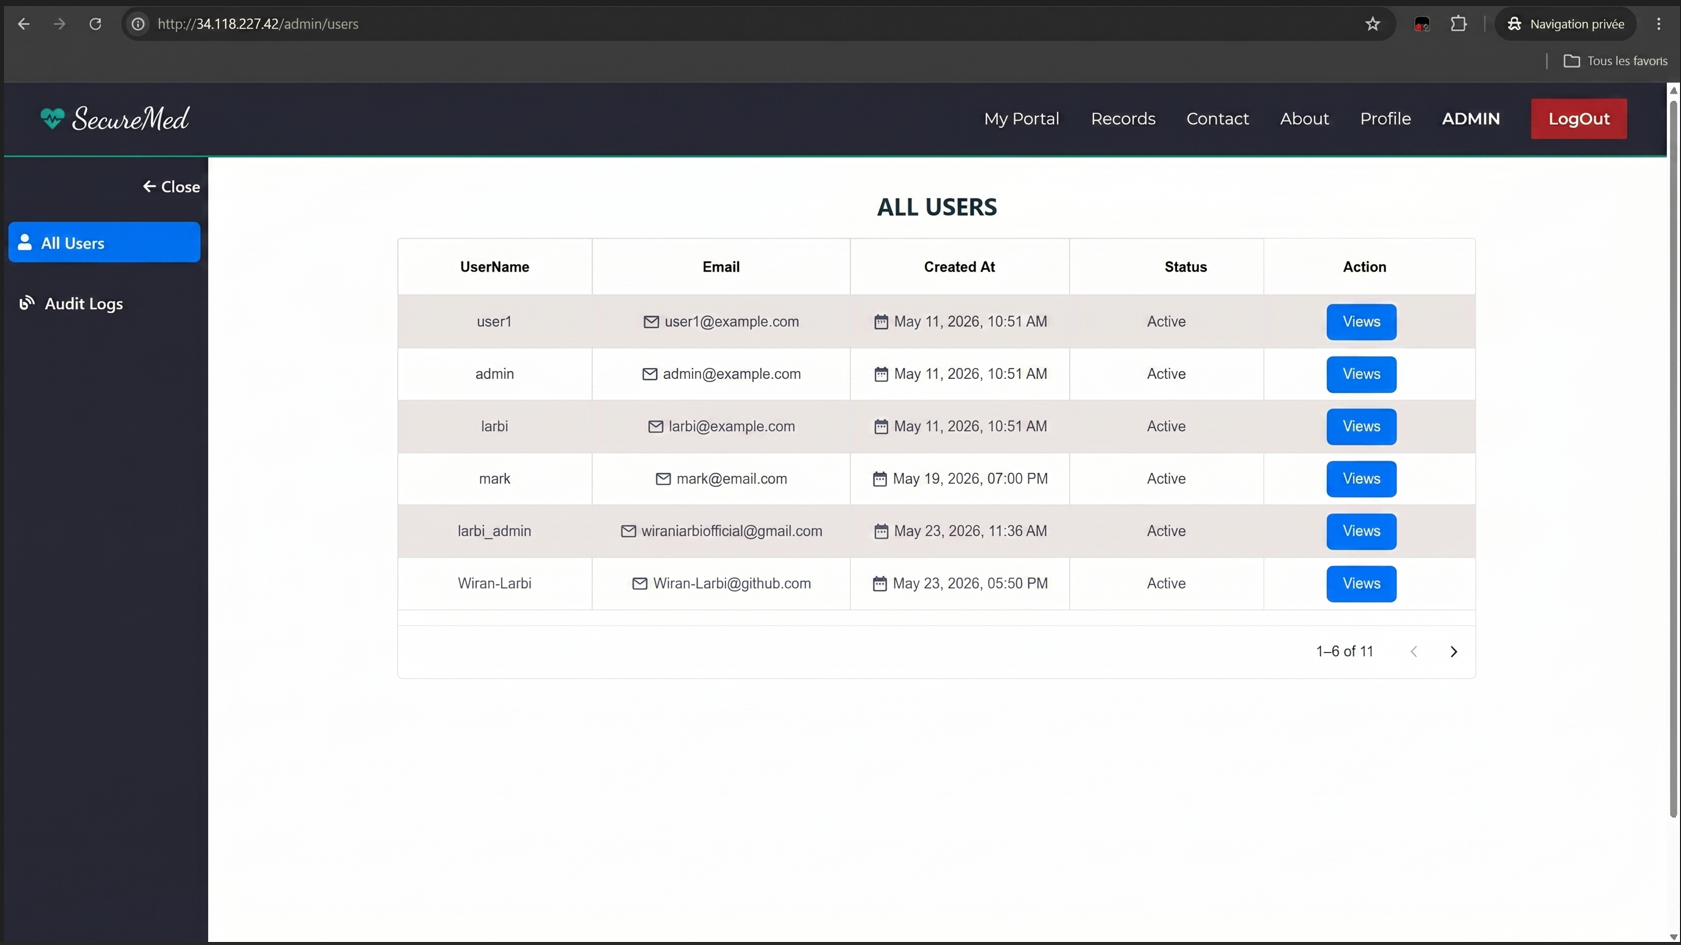
- Authentication: OAuth2 Integration (GitHub, Google), JWT, and MFA.
- Security First: Comprehensive CI/CD security scanning, network isolation, and GCP Secret Manager integration.
- Deep Observability: Fully integrated
kube-prometheus-stack(Prometheus & Grafana) via Spring Boot Micrometer.
🏗️ Architecture
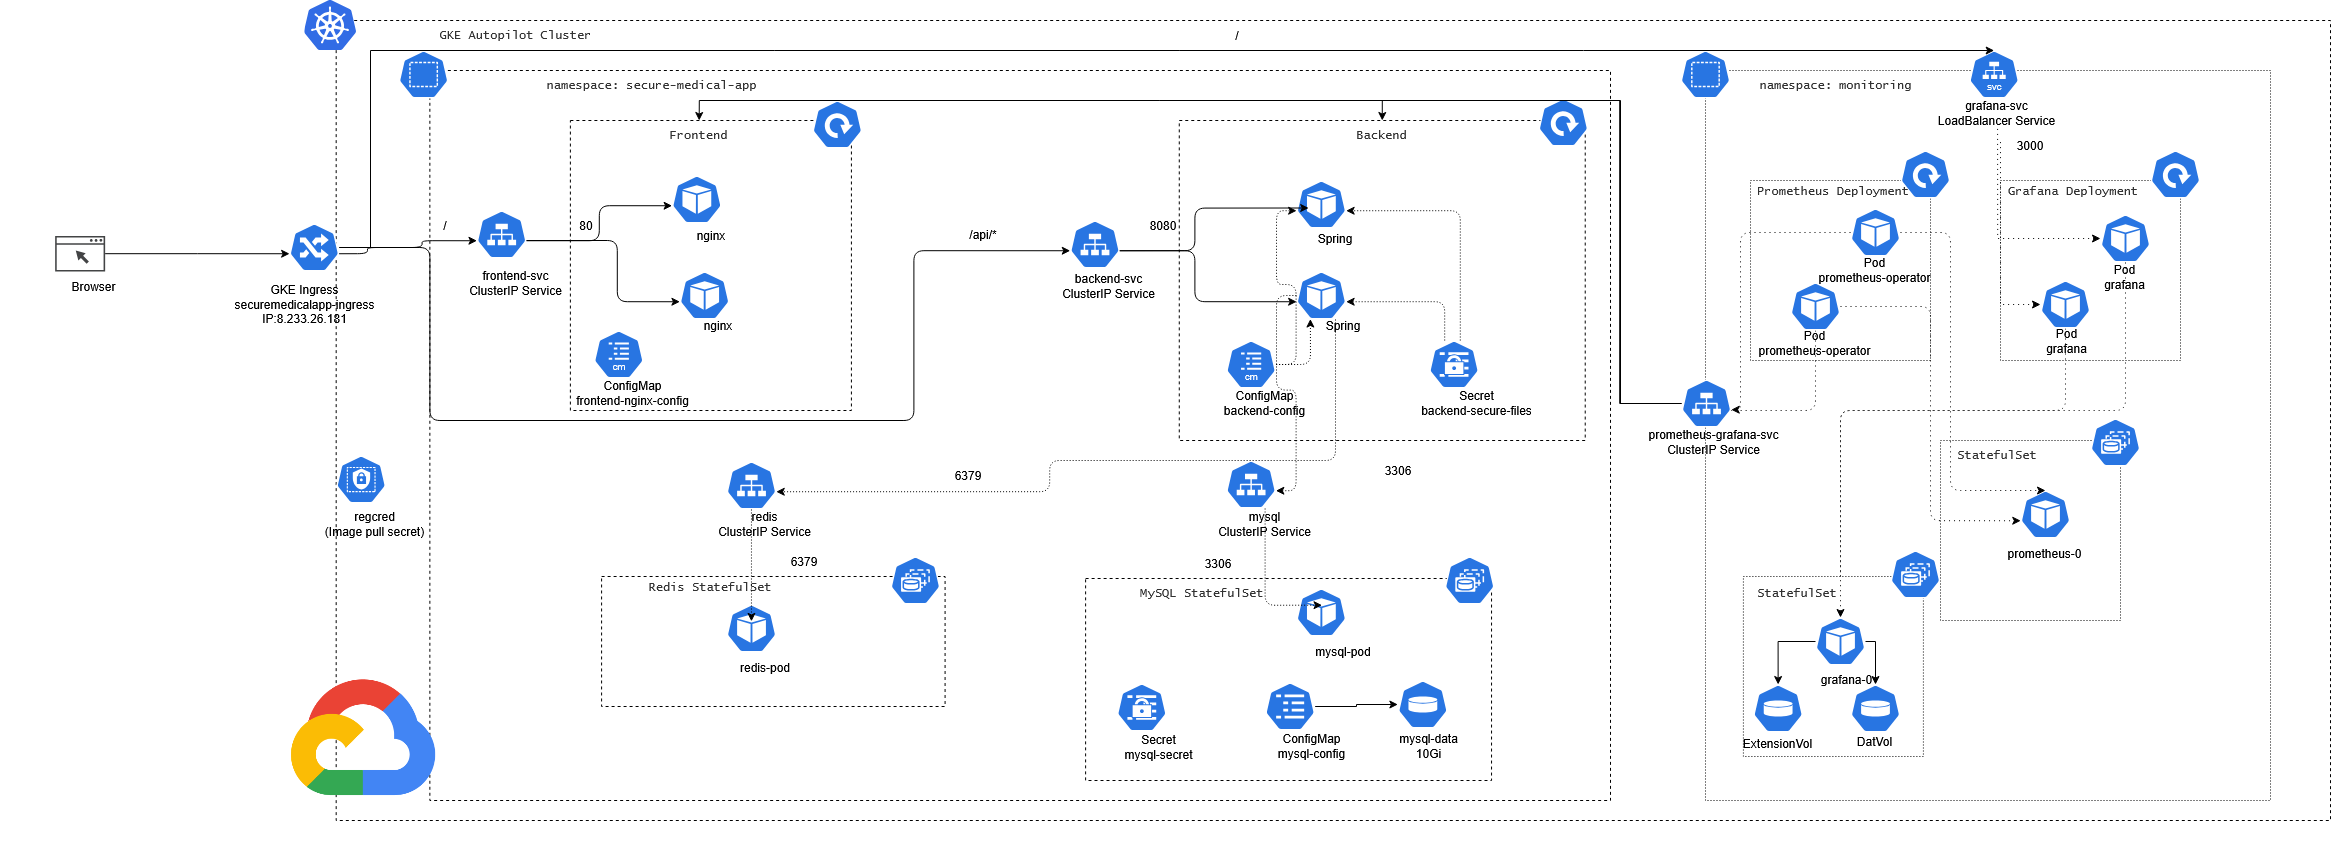
The application runs across two namespaces in GKE Autopilot:
secureapp: Houses the application components, ConfigMaps, and Secrets.monitoring: Houses the Prometheus Operator, Grafana, and Alertmanager.
Traffic is routed via a GCE L7 Load Balancer managed by a Kubernetes Ingress, ensuring HTTPS termination and path-based routing (/ for Frontend, /api/* for Backend).
Component Topology
- Frontend: 2 Replicas (Stateless)
- Backend: 2 Replicas (Stateless)
- MySQL: 1 Replica (StatefulSet with 10Gi PVC)
- Redis: 1 Replica (StatefulSet with 2Gi PVC)
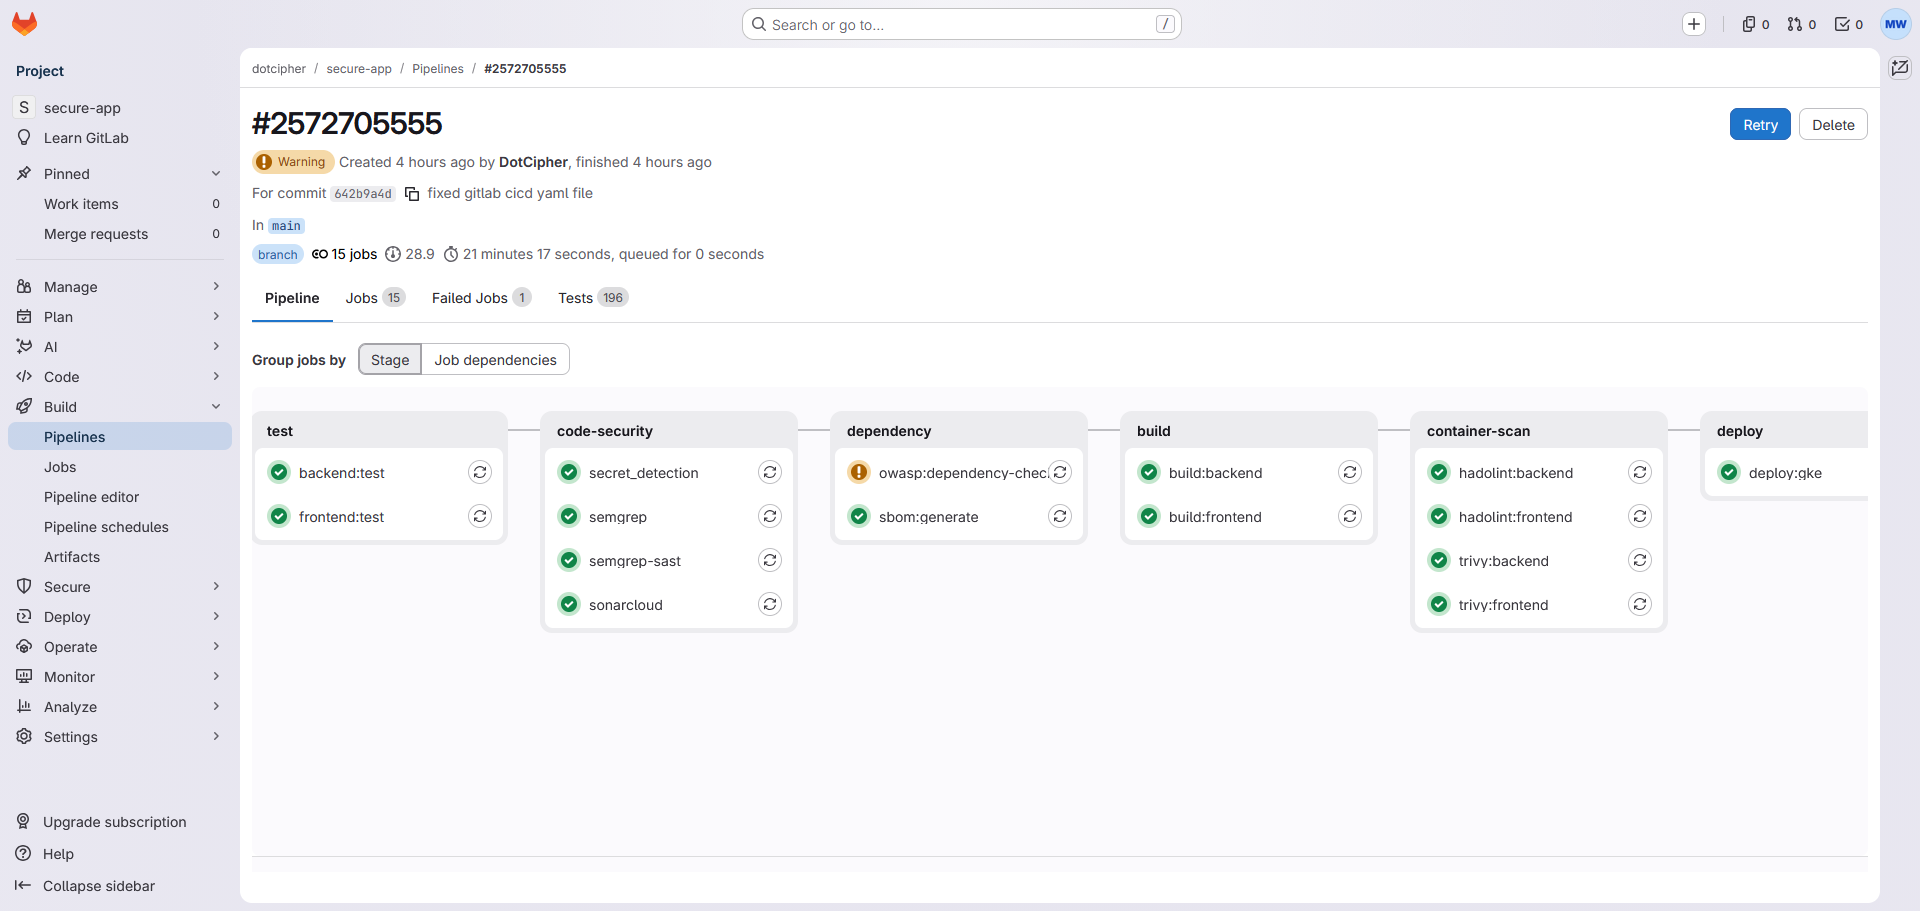
🛡️ DevSecOps Pipeline
The project utilizes a robust CI/CD pipeline (GitLab CI & Cloud Build) with 6 distinct stages:
- Test: Unit testing with real MySQL/Redis services via Testcontainers.
- Code Security:
- SonarCloud & Semgrep (OWASP Top 10, JWT, React rules).
- GitLab SAST & Secret Detection.
- Dependency Scanning: OWASP Dependency Check (fails on CVSS ≥ 7) and CycloneDX SBOM generation.
- Build: Parallel Docker builds pushed to Artifact Registry / GitLab Container Registry.
- Container Scan: Hadolint for Dockerfile linting and Trivy for CVE scanning (High/Critical).
- Deploy: Manual deployment gate to GKE Autopilot.
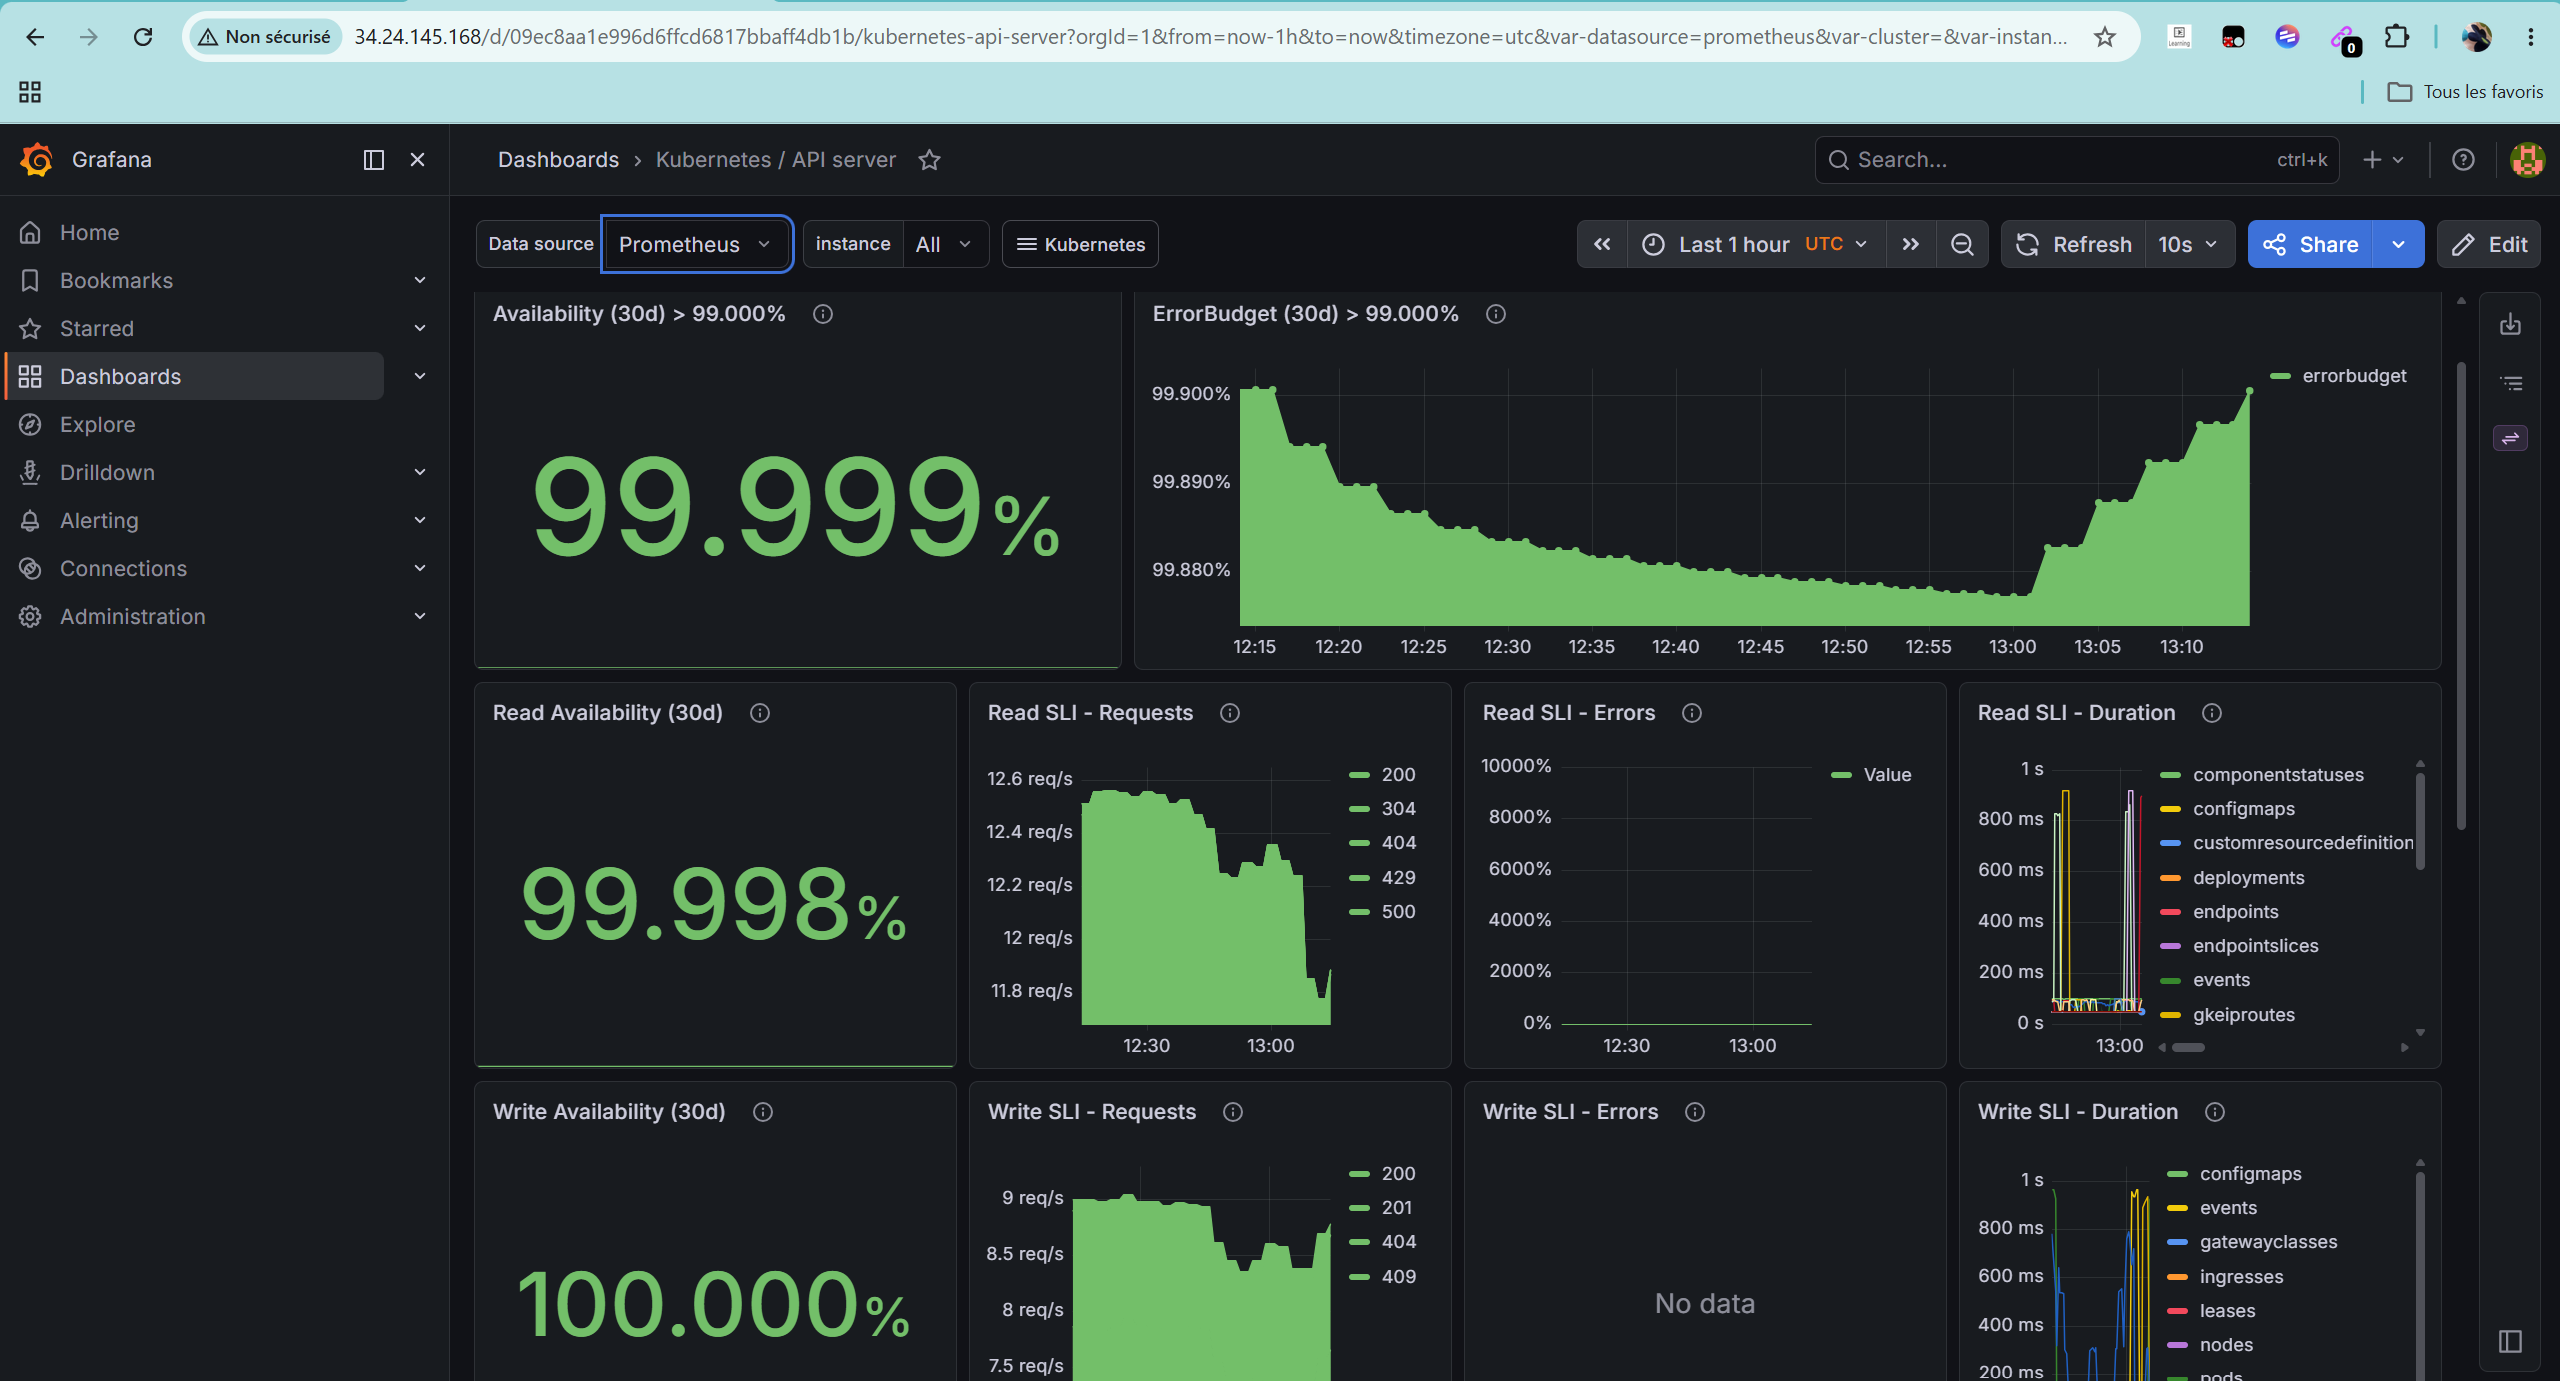
📊 Observability & Monitoring
The cluster features a fully automated monitoring pipeline bridging the application and monitoring namespaces via a Kubernetes ServiceMonitor.
- Metrics Exposure: Spring Boot Actuator exposes JVM, HTTP, HikariCP, and Redis metrics at
/actuator/prometheus. - Prometheus Operator: Automatically discovers the
backend-monitorServiceMonitor. - Grafana: Pre-configured dashboards query the Prometheus Server to visualize application and cluster health.
To run the automated monitoring health check:
bash check-monitoring-health.sh
To access Grafana locally (Login: admin / admin):
kubectl port-forward -n monitoring svc/prometheus-grafana 3000:80
📸 Application Screenshots
🚀 Getting Started
Local Development
You can run the entire stack locally using Docker Compose:
# Start MySQL, Redis, Backend, and Frontend
docker-compose up -d

# Check service logs
docker-compose logs -f
Deploying to GKE Autopilot
The project includes an automated deployment script for shell-based provisioning:
# Make the script executable
chmod +x deploy-from-shell.sh

# Run the deployment
./deploy-from-shell.sh
Deployment Script Highlights:
- Installs the NGINX Ingress Controller (or uses GCE Ingress).
- Deploys the application manifests (
k8s/). - Provisions the complete
kube-prometheus-stackwith specific overrides for GKE Autopilot compatibility (e.g., disabling control plane components likekubeSchedulerandkubeEtcd). - Verifies rollout statuses for all deployments and statefulsets.
📂 Project Structure
.
├── backend/                  # Spring Boot Java 21 Application
├── frontend/                 # React SPA & Nginx configuration
├── k8s/                      # Kubernetes Manifests
│   ├── backend/              # Deployment, Service, ConfigMap, ServiceMonitor
│   ├── frontend/             # Deployment, Service, ConfigMap
│   ├── mysql/                # StatefulSet, Headless Service
│   └── redis/                # StatefulSet, Headless Service
├── .gitlab-ci.yml            # GitLab DevSecOps Pipeline
├── cloudbuild.yaml           # Google Cloud Build Pipeline
├── docker-compose.yml        # Local Development Stack
├── deploy-from-shell.sh      # Automated GKE Deployment Script
└── check-monitoring-health.sh# Monitoring validation toolkit